Overview
This document provides detailed information about the core components of the Main analysis pipeline. The pipeline transforms raw multiplex imaging data into quantified single-cell profiles through a series of carefully orchestrated processing stages.
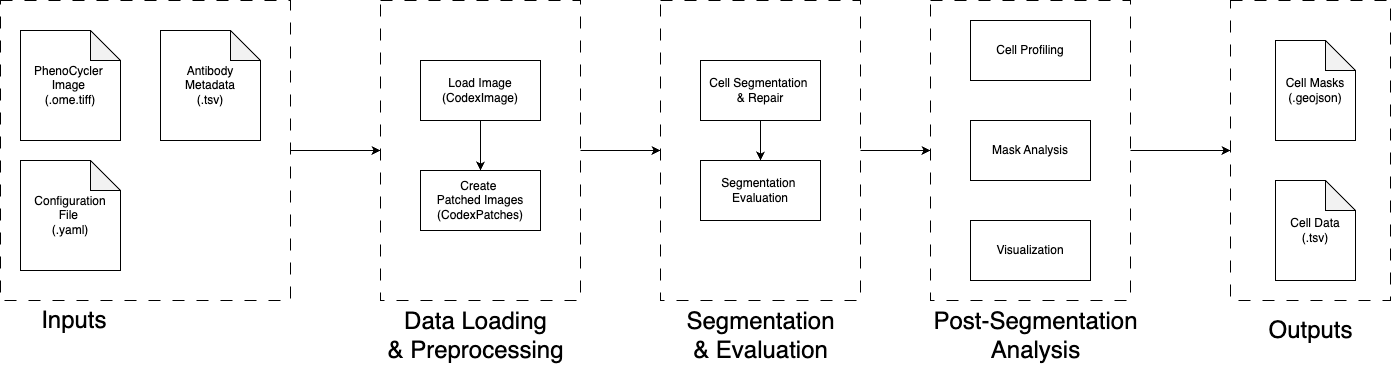
Pipeline Architecture
The Main pipeline consists of two primary processing phases that work together to extract meaningful biological information from large-scale multiplex imaging data:
Output Structure
The pipeline generates comprehensive outputs organized in a structured format:
output_directory/
├── cell_profiling/              # Single-cell data
│   ├── patch-0-cell_by_marker.csv
│   └── patch-0-cell_metadata.csv
├── extracted_channel_patches.npy.zst   # Processed image patches
├── original_seg_res_batch.pickle   # Raw segmentation results
├── matched_seg_res_batch.pickle    # Processed segmentation results
├── patches_metadata.csv            # Patch-level metadata
├── channel_stats.csv              # Channel statistics
└── copied_config.yaml             # Configuration record
└── seg_evaluation_metrics.pkl.gz     # Segmentation evaluation results
Data Loading and Preprocessing
Before segmentation, the pipeline loads the image and the antibodies data and prepare objects for further processing.
Load Image and Antibodies Data
This initial phase loads the multiplex image and the antibodies data into the CodexImage object.
Then Calculate channel-level statistics (Min, Median, Max, 95%, Mean, Std Dev) and save them to a file channel_stats.csv.
Next, extract the target channels from the image based on the configuration. If more than one wholecell channel is specified, they will be merged into a single channel by taking the maximum intensity projection. The extracted channels are stacked along the third dimension in the order of (nucleus, wholecell) and assigned to the extracted_channel_image attribute of the CodexImage object.
Patch-Based Processing
Ideally, we just use patching::split_mode as full_image and consider the image as a single patch for segmentation. However, sometimes the image is too large to be processed in a single patch, we can use patching::split_mode as halves or quarters to divide the image into manageable patches. I had situation that after spliting, the image is still too large to fit into memory. So we implemented a disk-based patches strategy to handle large images. See _extract_patches_from_coordinates in codex_patches.py. But we should implment more unit test to make sure the disk-based patches strategy is working as expected.
On the other hand, we would like to do segmentation on small patches for other purposes, such as patch-level analysis. We can use patching::split_mode as patches to divide the image into small patches. The patching::patch_height and patching::patch_width are the height and width of each patch, and the patching::overlap is the overlap fraction between adjacent patches. We have a web app to visualize the patches with the overlap to have intuition about the patches. Two have patches in same shape, we have two steps:(1) extend the image for full patch coverage and (2) generate the patches on the extended image. The patches are saved in the CodexPatches object as extracted_channel_patches and all_channel_patches attributes.
The metadata of patches are calculated, including patch_id, height, width, nucleus_mean, nucleus_std, nucleus_non_zero_perc, wholecell_mean, wholecell_std, wholecell_non_zero_perc. Config has patch_qc section to control the quality control, including
non_zero_perc_threshold: Minimum fraction of non-zero pixels required for a patch to be considered validmean_intensity_threshold: Minimum mean intensity for the patch to be considered informativestd_intensity_threshold: Minimum standard deviation required to avoid marking patches as too "flat" Currently the first two are used. A patch is considered empty if thenucleus_non_zero_percis less thannon_zero_perc_thresholdand considered noisy if thenucleus_meanis less thanmean_intensity_thresholdand it is set asis_emptyandis_noisyinpatches_metadata. Either of them is true, the patch is marked as bad and set asis_bad_patchinpatches_metadata. The patches are marked as informative if they are not bad. Details seeqc_patch_metadataincodex_patches.py. It helps to filter out the patches which are background, artifacts, or just a small part of the tissue. We will only run segmentation on the informative patches.
The matadata is saved as patches_metadata attribute of the CodexPatches object and saved in the patches_metadata.csv file.
Optional Patch Perturbations
To test the robustness of downstream segmentation models, we implment this module to add controlled perturbations to the patches. So that we can benchmarking the segmentation models on different types of data disruptions. It should not be used in the production environment.
- If
testing::data_disruption::typeis None, no perturbations will be added. - If
testing::data_disruption::typeisgaussian, we will add Gaussian noise to the patches. The noise level is controlled bytesting::data_disruption::level. The noise level is a number between 1 and 5. 1 is the minimal noise level and 5 is the maximal noise level. - If
testing::data_disruption::typeisdownsampling, we will downsample the patches. The downsampling level is controlled bytesting::data_disruption::level. The downsampling level is a number between 1 and 3. 1 is the minimal downsampling level and 3 is the maximal downsampling level.
We can use testing::data_disruption section to control the perturbations. Details see add_disruptions in codex_patches.py.
TODO: It might be better to isolate this module from the main pipeline. So that we can use it in the production environment. But we need to make more changes and divide the pipeline into more components such that the output from perturbation module can be integrated into the main pipeline.
Optional Patch Visualizations
We generate the visualizations of the patches to help the user to check the quality of the patches and the perturbations.
Notes: Given visualization::visualize_patches is True, if testing::data_disruption::visualize_disrupted is True, the visualizations will be the disrupted patches. Otherwise, the visualizations will be the original patches.
Visualization Configuration:
testing:
  data_disruption:
    # Disruption type can be "downsampling" or "gaussian"
    type: gaussian
    # Intensity level of disruption (1-5, for instance)
    level: 3
    # Whether to save the disrupted patches to disk (for debugging/testing)
    save_disrupted_patches: True
    # Whether to visualize the disrupted patches
    visualize_disrupted: False
Outputs:
patches_visualizations/good_patches/patch-{i}.pngpatches_visualizations/bad_patches/patch-{i}.png
Segmentation and Evaluation
This stage covers both segmentation and automated quality assessment.
Cell Segmentation
This phase performs cell and nucleus segmentation on the informative patches using the DeepCell Mesmer model. The segmentation process identifies individual cells and their corresponding nuclei, enabling downstream single-cell analysis. The run_cell_segmentation function in segment.py orchestrates the entire segmentation process:
- Patch Selection: Only processes patches marked as informative (not empty or noisy) from Phase B
- Model Loading: Loads the pre-trained DeepCell Mesmer model for multiplex segmentation
- Segmentation Processing: Applies the model to extract cell and nucleus masks
- Mask Repair: Matches cells to nuclei and repairs segmentation artifacts
- Result Storage: Saves segmentation masks and metadata
More details see Segmentation Details.
Segmentation Configuration:
segmentation:
  # Path to the DeepCell Mesmer model
  model_path: /path/to/MultiplexSegmentation
  # Save segmentation masks as image files
  save_segmentation_images: true
  # Save complete segmentation results as pickle
  save_segmentation_pickle: true
Outputs
- Segmentation Masks (per patch):
cell_matched_mask: Matched cell segmentation masksnucleus_matched_mask: Matched nucleus segmentation maskscell_outside_nucleus_mask: Cell regions outside nucleus boundaries
- Metadata:
patches_metadata.csv: Updated withmatched_fractionfor each patch- Segmentation quality statistics and matching metrics
- Optional Outputs:
- Segmentation mask images (if
save_segmentation_images: true) - Complete
CodexPatchespickle file (ifsave_segmentation_pickle: true)
- Segmentation mask images (if
Segmentation Evaluation
This step is the automated segmentation quality assessment using the run_seg_evaluation function implemented in evaluation.py. This evaluation system provides comprehensive metrics to assess the quality of cell segmentation results. The evaluation process follows these key steps:
- Patch Filtering: Only evaluates informative patches (marked as
is_informativein metadata) - Cell Count Validation: Skips patches with fewer than 20 cells to ensure statistical reliability
- Parallel Processing: Uses 2 worker processes for efficient evaluation across multiple patches
- Comprehensive Metrics: Calculates 14 different quality metrics for each patch
- Quality Score Generation: Combines metrics into a single quality score using PCA-based model
More details see Evaluation Details.
Evaluation Configuration:
evaluation:
  compute_metrics: false
Outputs
The evaluation results are stored in codex_patches.seg_evaluation_metrics as a list of dictionaries, where each dictionary contains and saved in the seg_evaluation_metrics.pkl.gz file.
Post-Segmentation Analysis
There are three modules to perform post-segmentation analysis: cell profiling, QC metrics, and visualizations.
Cell Profiling
This module performs cell-level profiling on each patch, generating a cell-by-marker matrix and a cell metadata table. For split modes 'full_image', 'halves', or 'quarters', results are merged into single files. For 'patches' mode, separate files per patch are saved.
Note: Currently, the
nucleus_matched_maskis as the cell identification mask. We should extend this step to generate cell profiling based on matched cell mask and also the unmatched cell mask (the direct output from the segmentation model).
This module has no configuration parameters in the config file yet.
Outputs
If patching::split_mode is full_image, halves, or quarters, the outputs are merged into single files.
cell_profiling/cell_by_marker.csv: Cell-by-marker matrixcell_profiling/cell_metadata.csv: Cell metadata table
If patching::split_mode is patches, the outputs are saved in the cell_profiling/ directory.
cell_profiling/patch-{i}-cell_by_marker.csv: Cell-by-marker matrixcell_profiling/patch-{i}-cell_metadata.csv: Cell metadata table
Mask Analysis for Sample Quality Assessment
This module performs analysis on segmentation results. We are exploring to use the statistics from segmentation results to describe the data quality. The metrics are including:
- Matched fraction: Percentage of nuclei successfully paired with cells
- Cell density metrics: Global and local density measurements
- Intensity analysis: Channel-wise intensity bias and distribution visualization
Configuration:
segmentation:
  segmentation_analysis: True
  density_analysis:
    calculate_global_density: True
    calculate_local_density: True
Outputs:
segmentation_analysis/: Directory containing all analysis resultscodex_patches_segmentation_analysis.pickle: Complete analysis datapatch_*/: Individual patch analysis visualizations
patches_metadata.csv: Updated with calculated QC metrics